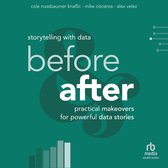
Storytelling with Data Before and After - Practical Makeovers for Powerful Data Stories
Samenvatting
Practical makeovers. Proven strategies. Powerful data stories.
From bestselling author Cole Nussbaumer Knaflic and expert data storytellers Mike Cisneros and Alex Velez, storytelling with data: before & after draws on more than a decade of experience helping leading organizations communicate more effectively with data. Through 20 real-world makeovers, you'll see how cluttered, confusing visuals transform into clear and compelling graphs and slides.
Learn what to do—and why it works—so you can tell data stories that inform, influence, and inspire action.
Global praise for before & after
"This helpful book distills years of expertise developed by Cole Nussbaumer Knaflic and her team, who have trained people in organisations all over the world to tell better stories with data using well-designed charts and clear, focused narratives. Recommended for anyone who makes presentations and reports containing data."
—Duncan Clark, CEO of Flourish and Head of Europe at Canva
"This book offers something we desperately need—practical, tangible examples that show how to turn charts into compelling, decision-driving visuals. The clear before-and-after makeovers, paired with explanations of what was changed and why, make it easy to understand and apply the lessons. Better storytelling leads to better decisions. I can't wait to share this book with everyone I work with!"
—Stephanie Chenevert, Senior Director, Google
"Since her first book was published a decade ago, Cole Nussbaumer Knaflic has become a reliable source of sound advice on chart design. The latest installment in her series, storytelling with data: before & after, is my favorite. I’m a great believer in learning by doing and by observing what other chart creators do, so a book that exemplifies how design principles apply to tricky real-world situations is educational—and fun!"
—Alberto Cairo, Knight Chair at the University of Miami and author of The Art of Insight
How do you turn a forgettable graph into a compelling data story?
For more than a decade, the team at storytelling with data has helped leading organizations and countless professionals transform their business communications into action-inspiring narratives. Now, they're bringing the best of those lessons to you—in the beloved before-and-after format synonymous with their popular workshops. Through twenty powerful makeovers, watch ineffective charts evolve into engaging visuals that captivate, inform, and lead to smarter decisions.
World-renowned data storytellers Mike Cisneros, Alex Velez, and SWD founder Cole Nussbaumer Knaflic guide you through proven methods to strengthen your communications, sharing the thought process behind each redesign so you can confidently apply the concepts to your work. Building on core principles from the international bestseller storytelling with data, refined through thousands of workshops, they demonstrate the straightforward, intentional changes—like simplifying visuals, eliminating clutter, and emphasizing key insights—that will transform your graphs and slides from the expected to the extraordinary.
In storytelling with data: before and after, you'll learn how to:
- Structure stories that connect with your audience
- Create visuals that clarify complex information
- Apply color, layout, and design to focus attention on what matters most
- Overcome common challenges like time constraints and poorly designed templates
- Craft narratives that make an impact and influence outcomes
Every page of storytelling with data: before and after is packed with insights drawn from real-world experience, distilled into easy-to-implement strategies. No matter your role, experience level, or comfort with data, you'll learn practical lessons you can apply right away. Each transformation delivers meaningful takeaways to help you create data stories that resonate—and get results.
This book is your ultimate blueprint for turning graphs into persuasive, decision-driving stories.
Productspecificaties
Inhoud
- Taal
- en
- Uitvoering
- Paperback
- Oorspronkelijke releasedatum
- 23 september 2025
- Aantal pagina's
- 432
- Illustraties
- Nee
Vertaling
- Eerste Vertaler
- Originele titel
- Storytelling with Data: A Data Visualization Guide for Business Professionals
Betrokkenen
- Hoofdauteur
- Tweede Auteur
- Verteller
- Hoofduitgeverij
- Tweede Uitgeverij
Informatie over de fabrikant
- Fabrikant Naam
- Wiley-vch Gmbh
- Fabrikant Adres
- Boschstrasse 12 - Weinheim
- E-mailadres of online contactformulier van de fabrikant
- product_safety@wiley.com
Overige kenmerken
- AI-gegenereerd
- Nee
- Kookboek
- Nee
- Porno
- Nee
- Primaire Productiemaatschappij
- Wiley
- Product breedte
- 185 mm
- Product hoogte
- 25 mm
- Product lengte
- 231 mm
- Studieboek
- Ja
- Verpakking breedte
- 187 mm
- Verpakking hoogte
- 30 mm
- Verpakking lengte
- 232 mm
- Verpakkingsgewicht
- 1004 g
EAN
- EAN
- 9781394289615
Productveiligheid
De verantwoordelijk marktdeelnemer in de EU zorgt voor het nakomen van verplichtingen op het gebied van productveiligheid.
Je vindt dit artikel in
- Categorieën
- Boek, ebook of luisterboek?
- Taal
- Type boek
- Korting
Documenten
Reviews
Geschreven bij: Storytelling With Data
- Praktisch
- Compleet
- Toegankelijk
Dit boek doet precies wat het beloofd te doen. Het boek legt uit hoe je data op een begrijpbare manier grafisch kan tonen aan een publiek. De meeste grafieken die men normaal maakt zitten vol met toeters en bellen en zijn over het algemeen niet overzichtelijk en kosten vaak te veel denkkracht om deze te ontcijferen en tegelijk naar een verhaal te luisteren. In dit boek wordt uitgelegd hoe we complexe grafieken kunnen vereenvoudigen en waar we op moeten letten. Tevens wordt ingegaan hoe we met deze vereenvoudigde grafieken een verhaal kunnen opbouwen wat blijft hangen in het geheugen van de luisteraars. Dit wordt gedaan aan de hand van vele cases en voorbeelden. Tevens wordt in het boek goed verwezen naar extra informatie en waar deze te vinden is.
Geschreven bij: Storytelling With Data
- Toegankelijk
- Praktisch toepasbaar
- Heldere uitleg
Ik geef trainingen Infographics en 'betere informatie', en raad deelnemers altijd dit boek aan. Het is eenvoudig, helder en gaat precies ver genoeg om professionals bij overheden en instellingen te helpen. (Ik heb er geen belang bij dit aan te raden)
Geschreven bij: Storytelling With Data
- Toegankelijk
- Praktisch toepasbaar
- Heldere uitleg
- Geen
Het boek beschrijft hoe mensen dashboards en reports bekijken en/of lezen. Vanuit die punten worden handvatten gegeven om vervolgens dashboards en reports te verbeteren. Aangedragen tips zijn direct toepasbaar of geven nieuwe inzichten met betrekking tot het presenteren van data. In de tekst worden met regelmaat vaktermen gebruikt, maar is goed begrijpbaar voor zowel de personen die net met data werken als de personen die al langer met data werken.
Geschreven bij: Storytelling With Data
Goed boek voor mensen die aan de slag willen met data. Het boek geeft handige tips en tricks over hoe je het beste je data vormgeeft.
Geschreven bij: Storytelling With Data
- Praktisch toepasbaar
- Heldere uitleg
Heeft veel voorbeelden en real life oefeningen. Eén aanrader! Eye opening read.
Geschreven bij: Storytelling With Data
Het is een cadeau voor iemand en die zei er wat mee te kunnen
Kies gewenste uitvoering
Gratis verzending door bol vanaf 25 euro
Ophalen bij een bol afhaalpunt mogelijk
30 dagen bedenktijd en gratis retourneren via mijn bol
Dag en nacht klantenservice
Doordeweeks ook ’s avonds in huis