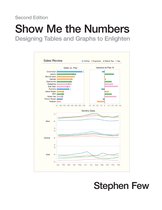
Show Me The Numbers Designing Tables and Graphs to Enlighten
Samenvatting
Addressing the prevalent issue of poorly designed quantitative information presentations, this accessible, practical, and comprehensive guide teaches how to properly create tables and graphs for effective and efficient communication. The critical numbers that measure the health, identify the opportunities, and forecast the future of organizations are often misrepresented because few people are trained to design accurate, informative materials, but this manual helps put an end to misinformation. This revised edition of the highly successful book includes updated figures and 91 additional pages of content, including new chapters about quantitative narrative and current misuses of graphs--such as donut, circle, unit, and funnel charts--and new appendices that cover constructing table lens displays and box plots in Excel and useful color palettes for presentation materials.
Productspecificaties
Inhoud
- Taal
- en
- Uitvoering
- Hardcover
- Oorspronkelijke releasedatum
- 01 juni 2012
- Aantal pagina's
- 351
- Illustraties
- Nee
Betrokkenen
- Hoofdauteur
- Hoofduitgeverij
Informatie over de fabrikant
- Fabrikant Naam
- Libri GmbH
- E-mailadres of online contactformulier van de fabrikant
- gpsr@libri.de
- Fabrikantgegevens
- De overige informatie van de fabrikant is momenteel niet beschikbaar.
Overige kenmerken
- Editie
- 2
- Extra groot lettertype
- Nee
- Product breedte
- 216 mm
- Product hoogte
- 32 mm
- Product lengte
- 279 mm
- Studieboek
- Nee
- Verpakking breedte
- 230 mm
- Verpakking hoogte
- 37 mm
- Verpakking lengte
- 290 mm
- Verpakkingsgewicht
- 1493 g
EAN
- EAN
- 9780970601971
Productveiligheid
De verantwoordelijk marktdeelnemer in de EU zorgt voor het nakomen van verplichtingen op het gebied van productveiligheid.
Je vindt dit artikel in
Documenten
Reviews
Select-leden verdienen punten met hun reviews
14 maart 201730-39 jaarGroningenHeeft dit artikel gekochtWdWWdW
- Toegankelijk
- Praktisch
- Compleet
- Mooi vormgegeven
Dit boek is exact wat het belooft te zijn: een schitterende gids voor het maken van tabellen en grafieken. Met een duidelijk verhaal wordt er verteld hoe bv. een een goede grafiek eruit dient te zijn, wat er mis is met bepaalde tabellen, welke kleurschema's je kan gebruiken voor je grafiek, etc. Voor mensen die veel bezig zijn met het maken van tabellen en/of grafieken: een absolute aanrader!
Kies gewenste uitvoering
Kies je uitvoering
Uiterlijk 16 oktober in huis
Prijs inclusief verzendkosten, verstuurd door bol
Ophalen bij een bol afhaalpunt mogelijk
30 dagen bedenktijd en gratis retourneren via mijn bol
Dag en nacht klantenservice