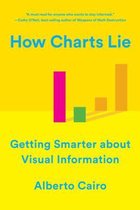
A leading data visualisation expert explores the negative—and positive-influences that charts have on our perception of truth.
Social media has made charts, infographics and diagrams ubiquitous—and easier to share than ever. While such visualisations can better inform us, they can also deceive by displaying incomplete or inaccurate data, suggesting misleading patterns—or misinform by being poorly designed.
Many of us are ill equipped to interpret the visuals that politicians, journalists, advertisers and even employers present each day, enabling bad actors to easily manipulate visuals to promote their own agendas. Public conversations are increasingly driven by numbers and to make sense of them, we must be able to decode and use visual information. By examining contemporary examples ranging from election-result infographics to global GDP maps and box-office record charts, How Charts Lie teaches us how to do just that.
Negatief, positief, neutraal: we zetten een review altijd online. We controleren wel eerst of ’ie voldoet aan onze reviewvoorwaarden en niet nep is. We controleren ook of ’ie is geschreven door iemand die het artikel heeft gekocht via bol.com en zetten dit er dan bij. De controles gebeuren automatisch, al kijken er soms mensen mee. Bol.com betaalt niet voor reviews. Als een reviewer door een andere partij is vergoed, staat dit in de review zelf.
De prijs van dit product is 22 euro en 89 cent.22
89
Uiterlijk 10 mei in huis
Levertijd
We doen er alles aan om dit artikel op tijd te bezorgen. Het is echter in een enkel geval mogelijk dat door omstandigheden de bezorging vertraagd is.
Bezorgopties
We bieden verschillende opties aan voor het bezorgen of ophalen van je bestelling. Welke opties voor jouw bestelling beschikbaar zijn, zie je bij het afronden van de bestelling.
Verkoop door bol
How Charts Lie – Getting Smarter about Visual Information