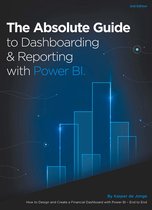
The Absolute Guide to Dashboarding and Reporting with Power BI How to Design and Create a Financial Dashboard with Power BI End to End
Afbeeldingen
Sla de afbeeldingen overArtikel vergelijken
Auteur:
Kasper De Jonge
- Engels
- Paperback
- 9781615470570
- 01 maart 2019
- 156 pagina's
Samenvatting
Written by a member of Microsoft’s Power BI team, this resource provides a practical step by step guide on creating a financial dashboard. The book covers in detail how to combine and shape the relevant data, build the dashboard in Power BI, providing layout and design tips and tricks, prepare the model to work with fiscal dates, and show values used in many financial reports, including year-to-date, variance-to-target, percentage-of-total, and running totals reports.
Productspecificaties
Wij vonden geen specificaties voor jouw zoekopdracht '{SEARCH}'.
Inhoud
- Taal
- en
- Bindwijze
- Paperback
- Oorspronkelijke releasedatum
- 01 maart 2019
- Aantal pagina's
- 156
- Illustraties
- Nee
Betrokkenen
- Hoofdauteur
- Kasper De Jonge
- Hoofduitgeverij
- Holy Macro! Books
Overige kenmerken
- Extra groot lettertype
- Nee
- Product breedte
- 209 mm
- Product hoogte
- 7 mm
- Product lengte
- 273 mm
- Studieboek
- Ja
- Verpakking breedte
- 195 mm
- Verpakking hoogte
- 11 mm
- Verpakking lengte
- 254 mm
- Verpakkingsgewicht
- 453 g
EAN
- EAN
- 9781615470570
Je vindt dit artikel in
- Categorieën
- Taal
- Engels
- Beschikbaarheid
- Leverbaar
- Boek, ebook of luisterboek?
- Boek
- Studieboek of algemeen
- Studieboeken
Kies gewenste uitvoering
Kies je bindwijze
(2)
Prijsinformatie en bestellen
De prijs van dit product is 31 euro en 83 cent.
2 - 3 weken
Verkoop door bol
- Prijs inclusief verzendkosten, verstuurd door bol
- Ophalen bij een bol afhaalpunt mogelijk
- 30 dagen bedenktijd en gratis retourneren
- Dag en nacht klantenservice
Vaak samen gekocht
Rapporteer dit artikel
Je wilt melding doen van illegale inhoud over dit artikel:
- Ik wil melding doen als klant
- Ik wil melding doen als autoriteit of trusted flagger
- Ik wil melding doen als partner
- Ik wil melding doen als merkhouder
Geen klant, autoriteit, trusted flagger, merkhouder of partner? Gebruik dan onderstaande link om melding te doen.


