Regression Graphics Ideas For Studying Regressions Through Graphics
Afbeeldingen
Sla de afbeeldingen overArtikel vergelijken
Auteur:
R. Dennis Cook
R. Dennis Cook
- Engels
- Hardcover
- 9780471193654
- 19 oktober 1998
- 350 pagina's
Samenvatting
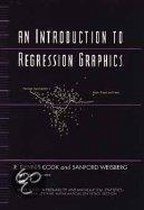
Simple graphs have always played a useful role in the analysis and presentation of data. Advances in computing have created the potential to substantially expand the role of visualization in statistical analyses. This book is about ideas for the graphical analysis of regression data.
An exploration of regression graphics through computer graphics.
Recent developments in computer technology have stimulated new and exciting uses for graphics in statistical analyses. Regression Graphics, one of the first graduate-level textbooks on the subject, demonstrates how statisticians, both theoretical and applied, can use these exciting innovations. After developing a relatively new regression context that requires few scope-limiting conditions, Regression Graphics guides readers through the process of analyzing regressions graphically and assessing and selecting models. This innovative reference makes use of a wide range of graphical tools, including 2D and 3D scatterplots, 3D binary response plots, and scatterplot matrices. Supplemented by a companion ftp site, it features numerous data sets and applied examples that are used to elucidate the theory.
Other important features of this book include:
* Extensive coverage of a relatively new regression context based on dimension-reduction subspaces and sufficient summary plots
* Graphical regression, an iterative visualization process for constructing sufficient regression views
* Graphics for regressions with a binary response
* Graphics for model assessment, including residual plots
* Net-effects plots for assessing predictor contributions
* Graphics for predictor and response transformations
* Inverse regression methods
* Access to a Web site of supplemental plots, data sets, and 3D color displays.
An ideal text for students in graduate-level courses on statistical analysis, Regression Graphics is also an excellent reference for professional statisticians.
Productspecificaties
Wij vonden geen specificaties voor jouw zoekopdracht '{SEARCH}'.
Inhoud
- Taal
- en
- Bindwijze
- Hardcover
- Oorspronkelijke releasedatum
- 19 oktober 1998
- Aantal pagina's
- 350
- Illustraties
- Nee
Betrokkenen
- Hoofdauteur
- R. Dennis Cook
- Tweede Auteur
- R. Dennis Cook
- Hoofduitgeverij
- Wiley-Interscience
Overige kenmerken
- Extra groot lettertype
- Nee
- Product breedte
- 163 mm
- Product hoogte
- 24 mm
- Product lengte
- 245 mm
- Studieboek
- Nee
- Verpakking breedte
- 171 mm
- Verpakking hoogte
- 25 mm
- Verpakking lengte
- 241 mm
- Verpakkingsgewicht
- 703 g
EAN
- EAN
- 9780471193654
Je vindt dit artikel in
- Categorieën
- Taal
- Engels
- Boek, ebook of luisterboek?
- Boek
- Beschikbaarheid
- Leverbaar
- Studieboek of algemeen
- Algemene boeken
Kies gewenste uitvoering
Bindwijze
: Hardcover
Prijsinformatie en bestellen
De prijs van dit product is 188 euro en 99 cent.
2 - 3 weken
Verkoop door bol
- Prijs inclusief verzendkosten, verstuurd door bol
- Ophalen bij een bol afhaalpunt mogelijk
- 30 dagen bedenktijd en gratis retourneren
- Dag en nacht klantenservice
Rapporteer dit artikel
Je wilt melding doen van illegale inhoud over dit artikel:
- Ik wil melding doen als klant
- Ik wil melding doen als autoriteit of trusted flagger
- Ik wil melding doen als partner
- Ik wil melding doen als merkhouder
Geen klant, autoriteit, trusted flagger, merkhouder of partner? Gebruik dan onderstaande link om melding te doen.
