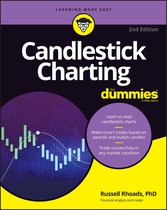
Candlestick Charting For Dummies
Afbeeldingen
Artikel vergelijken
- Engels
- Paperback
- 9781119869955
- 25 augustus 2022
- 352 pagina's
Samenvatting
Make smarter stock trades by reading the charts
Candlesticks come in handy when the power goes out, and candlestick charts can help shine a light on the movement of stock prices, so you’re not making investment decisions in the dark. Candlestick Charting For Dummies demystifies these weird little graphs, showing you how to read the charts, recognize the patterns, and start trading like a pro. Fully updated for the latest stock market trends and changes (including Bitcoin!), this book puts technical tools at your fingertips. Now, go run with the bulls (or the bears).
Inside…
- Basic candlestick terminology
- Finding and creating charts
- Bearish and bullish patterns
- Moving averages, trendlines, and other technical indicators
- Seeing buy and sell signals
- Trading short and long term
- Avoiding common pitfalls
Demystify stock charts so you can up your investing game
Candlestick Charting For Dummies is here to show you that candlestick charts are not just for Wall Street traders. Everyday investors like you can make sense of all those little lines and boxes, with just a little friendly Dummies training. We’ll show you where to find these charts (online or in your favorite investing app), what they mean, and how to dig out valuable information. Then, you’ll be ready to buy and sell with newfound stock market savvy.
Candlestick Charting For Dummies helps you build a foundation of investing knowledge and lingo (bullish? bearish? What is a candlestick, anyway?), then shows you the chart-reading ropes with relevant and easy-to-understand examples. It covers the latest investing technology, cryptocurrency, and today’s somewhat-less-predictable market environment.
- Get a refresher on stock market terminology and investing basics
- Discover how easy it is to understand price history and movement with candlestick charts
- Identify the best times to buy and sell securities, including stocks and crypto
- Learn from real life examples so you can invest with greater confidence and success
This is the Dummies guide for beginner and intermediate investors who want to make smarter decisions with a better understanding of how to read candlestick charts.
Productspecificaties
Inhoud
- Taal
- en
- Bindwijze
- Paperback
- Oorspronkelijke releasedatum
- 25 augustus 2022
- Aantal pagina's
- 352
- Illustraties
- Nee
Betrokkenen
- Hoofdauteur
- Russell Rhoads
- Hoofduitgeverij
- For Dummies
Overige kenmerken
- Editie
- 2
- Product breedte
- 183 mm
- Product hoogte
- 23 mm
- Product lengte
- 234 mm
- Studieboek
- Ja
- Verpakking breedte
- 184 mm
- Verpakking hoogte
- 23 mm
- Verpakking lengte
- 233 mm
- Verpakkingsgewicht
- 821 g
EAN
- EAN
- 9781119869955
Je vindt dit artikel in
- Taal
- Engels
- Boek, ebook of luisterboek?
- Boek
- Studieboek of algemeen
- Studieboeken
- Beschikbaarheid
- Leverbaar
Reviews
Negatief, positief, neutraal: we zetten een review altijd online. We controleren wel eerst of ’ie voldoet aan onze reviewvoorwaarden en niet nep is. We controleren ook of ’ie is geschreven door iemand die het artikel heeft gekocht via bol.com en zetten dit er dan bij. De controles gebeuren automatisch, al kijken er soms mensen mee. Bol.com betaalt niet voor reviews. Als een reviewer door een andere partij is vergoed, staat dit in de review zelf.
Negatief, positief, neutraal: we zetten een review altijd online. We controleren wel eerst of ’ie voldoet aan onze reviewvoorwaarden en niet nep is. We controleren ook of ’ie is geschreven door iemand die het artikel heeft gekocht via bol.com en zetten dit er dan bij. De controles gebeuren automatisch, al kijken er soms mensen mee. Bol.com betaalt niet voor reviews. Als een reviewer door een andere partij is vergoed, staat dit in de review zelf.
-
Zeer tevreden
Positieve punten
- Goede kwaliteit
Geschreven bij Candlestick Charting For Dummies
Volledig en praktisch boek
Vond je dit een nuttige review?00 -
Zeer goed
Positieve punten
- Goede kwaliteit
- Voordelige koop
Geschreven bij Candlestick Charting For Dummies
Positieve punten van dit artikel zijn: goede kwaliteit en voordelige koop.
Vond je dit een nuttige review?04
Kies gewenste uitvoering
Prijsinformatie en bestellen
De prijs van dit product is 27 euro en 99 cent.- Prijs inclusief verzendkosten, verstuurd door bol
- Ophalen bij een bol afhaalpunt mogelijk
- 30 dagen bedenktijd en gratis retourneren
- Dag en nacht klantenservice
- Vandaag nog in huis (bestel ma-vr voor 12:00, bezorging tussen 17:00 en 22:00)
- Doordeweeks ook ’s avonds in huis
- Ook zondag in huis (bestel voor za 23:59)
Vaak samen gekocht
Rapporteer dit artikel
Je wilt melding doen van illegale inhoud over dit artikel:
- Ik wil melding doen als klant
- Ik wil melding doen als autoriteit of trusted flagger
- Ik wil melding doen als partner
- Ik wil melding doen als merkhouder
Geen klant, autoriteit, trusted flagger, merkhouder of partner? Gebruik dan onderstaande link om melding te doen.


