Analysis of Experimental Data Microsoft®Excel or Spss??! Sharing of Experience English Version Ebook Tooltip Ebooks kunnen worden gelezen op uw computer en op daarvoor geschikte e-readers. Book 3
Afbeeldingen
Sla de afbeeldingen overArtikel vergelijken
- Engels
- E-book
- 9781499002263
- 15 juli 2014
- Adobe ePub
Samenvatting
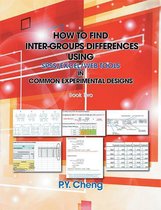
The first characteristic of this book is the skipping of difficult theories, starting directly with typical examples, and the working out of the answers clearly by computer software. The aim is to help readers to be able to solve basic statistical problems in various Common Experimental Designs as soon as possible, and to be confident to run the tests and interpret the computer output, without being hesitated by the starting with large amount of difficult theories behind. This book has been reviewed by some experts as very practical, illustrative and directive, and is very useful for both practitioners and those who perform statistical analysis in experimental designs One the other hand, there is a general belief that after getting a significant Anova result, using the built-in Analysis TookPak MicrosoftExcel Add-In, nothing can be done further to find where do the differences exist, and we must use large packages such as SPSS to complete the job! However, we find that this might not be absolutely true. We can often find similar results as using SPSS by combining the overall Anova results with a few, simple, manual steps introduced in this book! An MicrosoftExcel Add-In PHStat2 ver.3.0, from Dr Robert Jantzen, University of Connecticut, Stamford, is totally free also and seems even more powerful than Analysis TookPak, including a more automatic Tukeys-Kramer Multiple Comparison Post Hoc Test. Lastly, we would introduce a very powerful MicrosoftExcel Add-In, XLSTAT, that can perform many important statistical tests as if using SPSS! Although this is not totally free, it provides a 30 days full function trial version and a student annual price of only US$ 50, that is much cheaper than SPSS etc.! We would use it to show Repeated Measures, Repeated measures Anova and Ancova that are only analyzed by e.g. SPSS otherwise.
Productspecificaties
Inhoud
- Taal
- en
- Bindwijze
- E-book
- Oorspronkelijke releasedatum
- 15 juli 2014
- Ebook Formaat
- Adobe ePub
- Illustraties
- Met illustraties
Betrokkenen
- Hoofdauteur
- Ping Yuen Py Cheng
- Hoofduitgeverij
- Xlibris Au
Lees mogelijkheden
- Lees dit ebook op
- Android (smartphone en tablet) | Kobo e-reader | Desktop (Mac en Windows) | iOS (smartphone en tablet) | Windows (smartphone en tablet)
Overige kenmerken
- Studieboek
- Ja
EAN
- EAN
- 9781499002263
Waarom een wereldbollabel?
Artikelen met een wereldbol bezitten positieve eigenschappen vergeleken met soortgelijke artikelen, zoals bepaalde keur- of kenmerken op sociaal en ecologisch gebied.
Keur- of kenmerken
-
Digitaal boek
Onafhankelijk onderzoek toont aan dat als je meer dan 25 ebooks downloadt, dit een lagere milieuimpact heeft dan van fysieke boeken.
Kies gewenste uitvoering
Prijsinformatie en bestellen
De prijs van dit product is 4 euro en 99 cent.- E-book is direct beschikbaar na aankoop
- E-books lezen is voordelig
- Dag en nacht klantenservice
- Veilig betalen
Anderen bekeken ook
Rapporteer dit artikel
Je wilt melding doen van illegale inhoud over dit artikel:
- Ik wil melding doen als klant
- Ik wil melding doen als autoriteit of trusted flagger
- Ik wil melding doen als partner
- Ik wil melding doen als merkhouder
Geen klant, autoriteit, trusted flagger, merkhouder of partner? Gebruik dan onderstaande link om melding te doen.