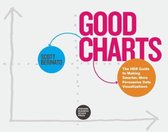
Good Charts, Updated and Expanded Ebook Info-bulle Les e-books sont lisibles sur votre ordinateur ou une liseuse adaptée. Le Guide HBR pour créer des visualisations de données plus Smarter et plus convaincantes
- en
- livre numérique
- 9781647825140
- 29 août 2023
- Adobe ePub
Résumé
The ultimate guide to data visualization and information design for business.
Making good charts is a must-have skill for managers today. The vast amount of data that drives business isn't useful if you can't communicate the valuable ideas contained in that data—the threats, the opportunities, the hidden trends, the future possibilities.
But many think that data visualization is too difficult—a specialist skill that's either the province of data scientists and complex software packages or the domain of professional designers and their visual creativity.
Not so. Anyone can learn to produce quality "dataviz" and, more broadly, clear and effective information design. Good Charts will show you how to do it.
In this updated and expanded edition, dataviz expert Scott Berinato provides all you need for turning those ordinary charts kicked out of a spreadsheet program into extraordinary visuals that captivate and persuade your audience and for transforming presentations that seem like a mishmash of charts and bullet points into clear, effective, persuasive storytelling experiences.
Good Charts shows how anyone who invests a little time getting better at visual communication can create an outsized impact—both in their career and in their organization. You will learn:
- A framework for getting to better charts in just a few minutes
- Design techniques that immediately make your visuals clearer and more persuasive
- The building blocks of storytelling with your data
- How to build teams to bring visual communication skills into your organization and culture
This new edition of Good Charts not only provides new visuals and updated concepts but adds an entirely new chapter on building teams around the visualization part of a data science operation and creating workflows to integrate visualization into everything you do.
Graphics that merely present information won't cut it anymore. Make Good Charts your go-to resource for turning plain, uninspiring charts and presentations into smart, effective visualizations and stories that powerfully convey ideas.
Spécifications produit
Contenu
- Langue
- en
- Binding
- livre numérique
- Date de sortie initiale
- 29 août 2023
- Format ebook
- Adobe ePub
Personnes impliquées
- Auteur principal
- Scott Berinato
- Editeur principal
- Harvard Business Review Press
Options de lecture
- Lisez cet ebook sur
- Ordinateur de bureau (Mac et Windows) | Lecteur électronique Kobo | Android (smartphone et tablette) | iOS (smartphone et tablette) | Windows (smartphone et tablette)
Autres spécifications
- Livre d‘étude
- Non
EAN
- EAN
- 9781647825140
Vous trouverez cet article :
- Catégories
- Langue
- Anglais
- Disponibilité
- Disponible à l'adresse suivante
- Livre, ebook ou livre audio ?
- Ebook
Choisissez la version souhaitée
Informations sur les prix et commande
Le prix de ce produit est de 24 euros et 99 cents.- E-book utilisable dès son achat
- Les e-books offrent plein d'avantages
- Service client 24h/24
- Paiement sécurisé
Signaler cet article
Vous souhaitez signaler un contenu illégal à propos cet article:
- Je souhaite faire un signalement en tant que client.
- Je veux faire un signalement en tant qu'autorité ou personne de confiance.
- Je veux faire un signalement en tant que propriétaire de partenaire
- Je veux faire un signalement en tant que propriétaire de marque
Vous n'êtes pas un client, une autorité, personne de confiance, propriétaire de marque ou un partenaire ? Dans ce cas, utilisez le bouton ci-dessous pour effectuer un signalement.
